SOC Data Dashboard
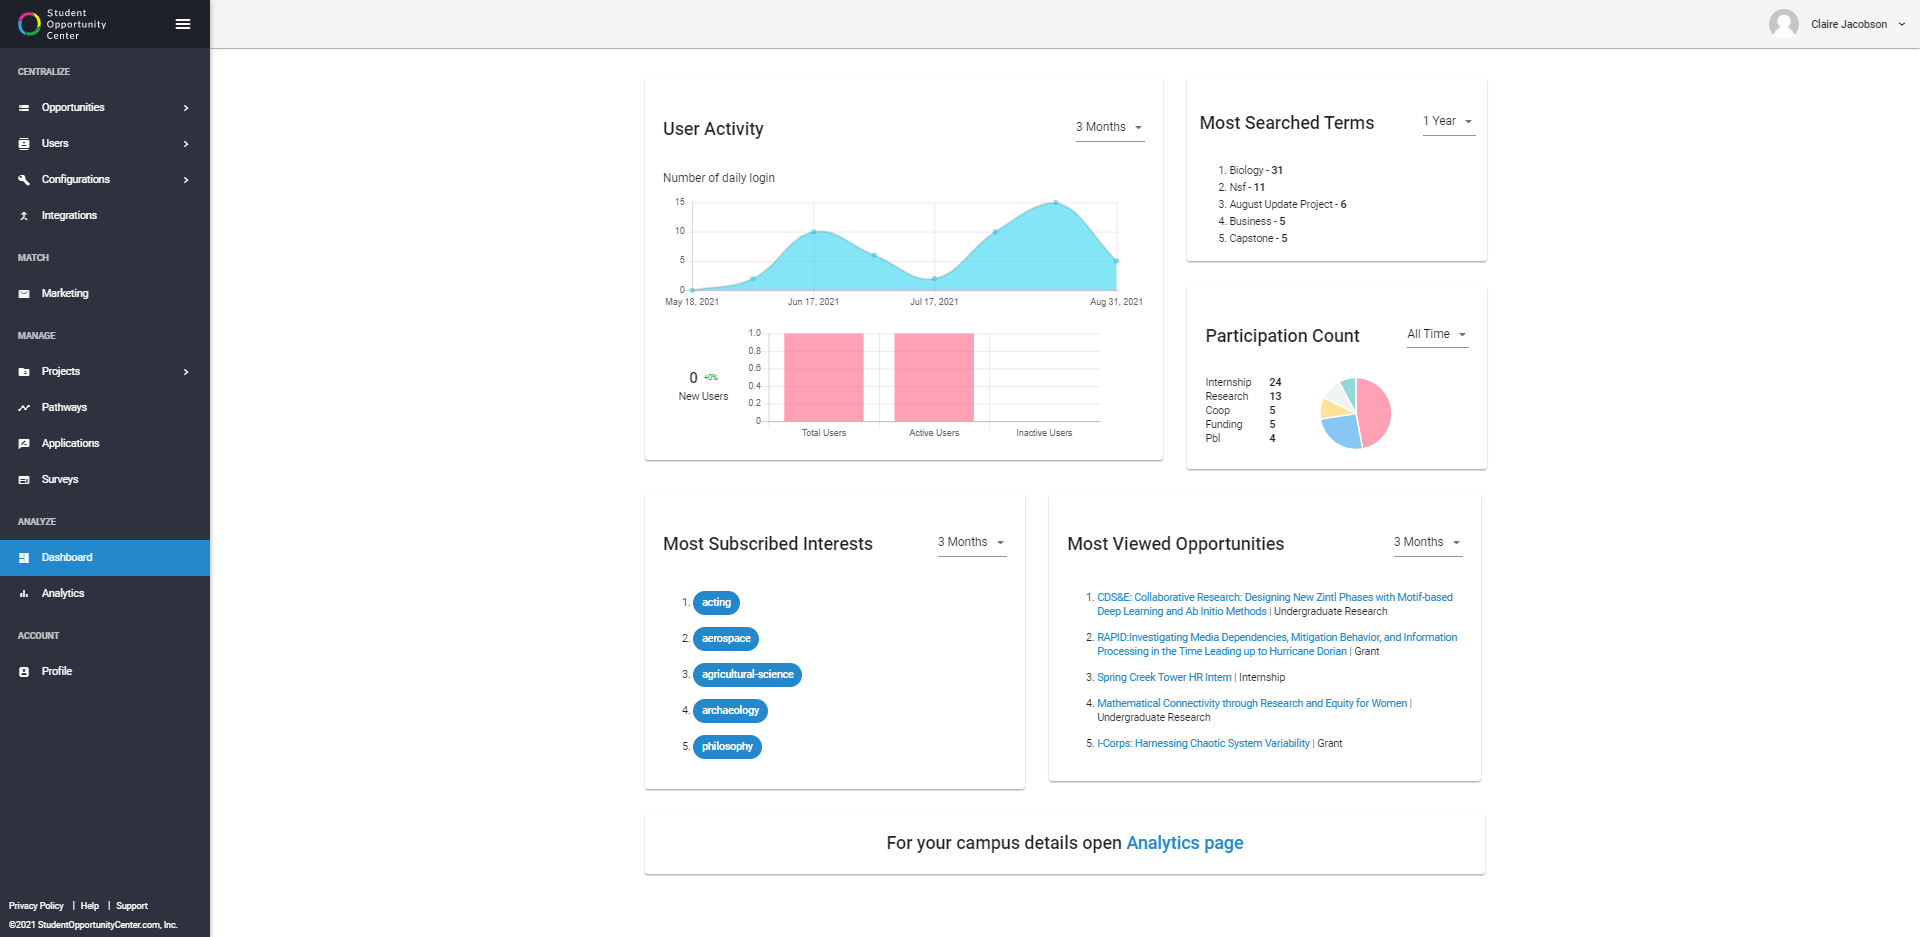
SOC’s new data dashboard gives you quick access to your most-searched information right from the SOC landing page.
- The dashboard is organized as a series of easy to view “cards” that display your campus’ most viewed stats.
- All data cards default to a showing a three-month period. You can change this timeframe in the top right corner of each card.
- To get more details about any of the data points, select “open analytics page” at the bottom of the dashboard page or select “analytics” from the left-side menu.

The data cards on the homepage are (clockwise):
User Activity:
This card displays your number of daily logins.
Most Searched Terms:
This card displays your campus’ five top most search terms, as well as the number of searches per term.
Participation Count:
If your campus uses SOC to track participation, this card will show the top five participation types, as well as the number of participants.
Most Viewed Opportunities:
This card displays the top five opportunities with the highest views, as well as their category, and links to the opportunity.
Most Subscribed Interests:
This card displays the top five interest areas to which students have subscribed.
Integration Opportunities:
If your campus has integrated external systems into SOC, this card shows your current integrations and the number of opportunities being integrated into SOC.
Analytics Page:
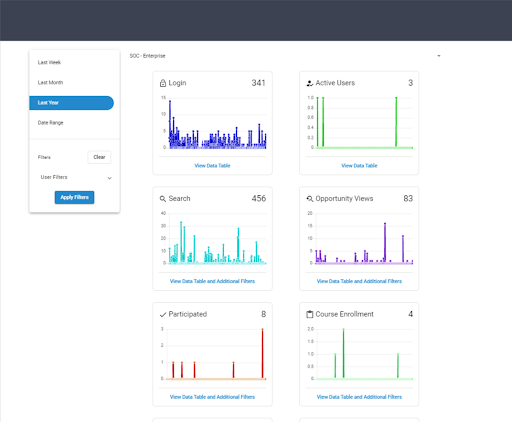
From the analytics page you can track login, active users, search, opportunity views, participated (if applicable), course enrollment (if applicable), favorites, applied, interest subscribed, and uploaded users.

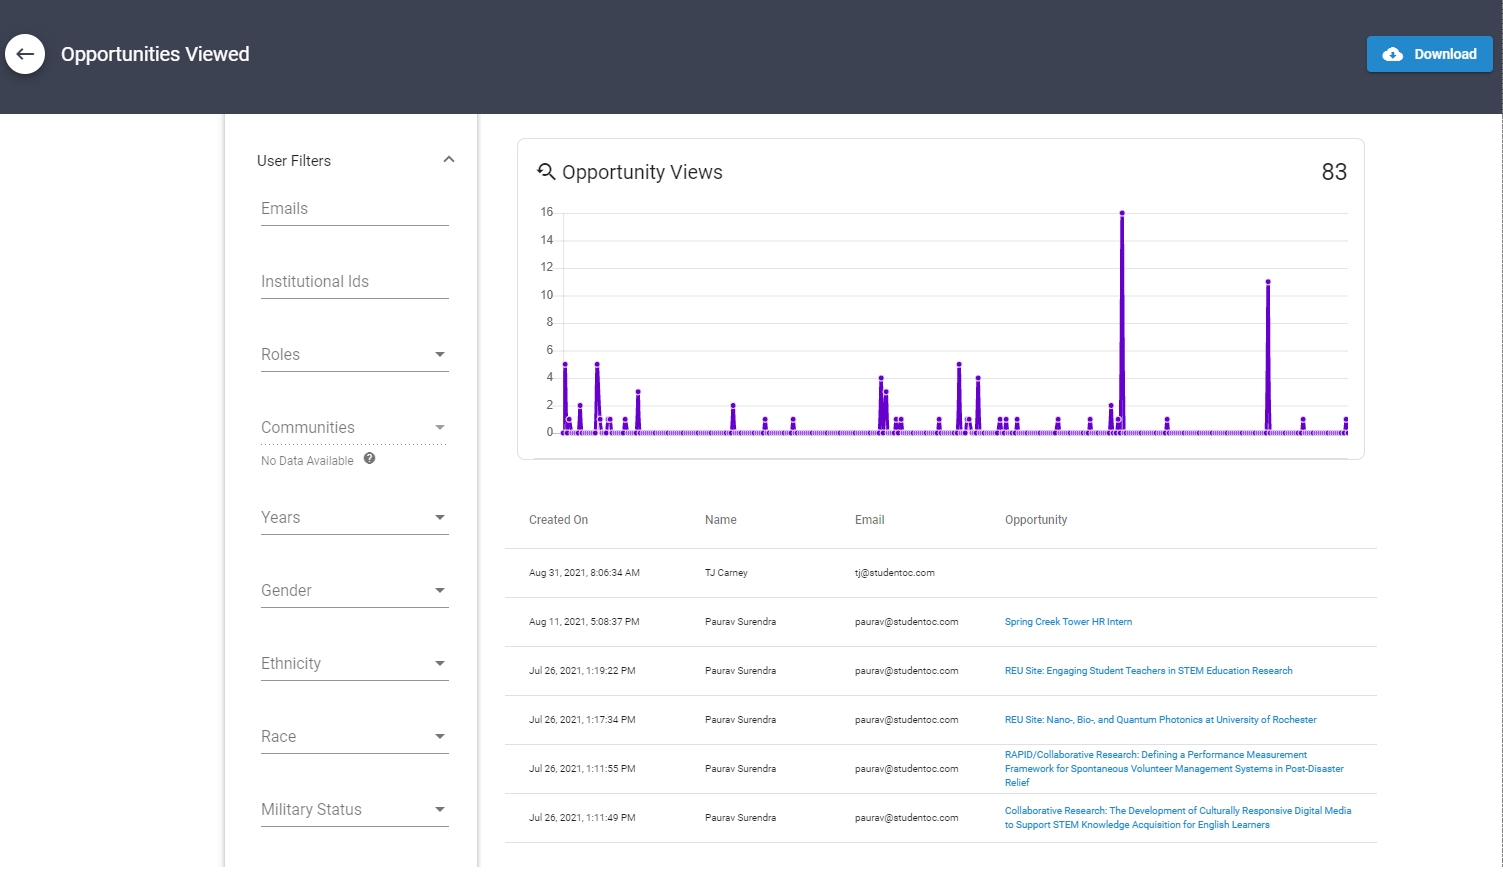
For more details on any of these fields and to apply additional filters, select “view data table.”
NOTE on applying filters:
To apply filters, first select the appropriate date range. Then select the filters you wish to apply and click the blue “Apply Filters” button. NOTE: only the filters available in your data set will be available.
Within a group of fields (e.g. race, first generation), filters act as “or,” meaning if you select both the “African American” + “Hispanic” choices in the race filter you will get results for students who are African American, as well as (or) students who are Hispanic.
Between a group of fields, the filters act as “and” filters, meaning if you select “yes” for both the “first generation” and “veteran” filters, you will get results for students who are both first generation and a veteran (adding additional filters will limit the results).
TIP: you can think of this like a shopping portal, if you select size 7, black, two-inch heel you will only get results for shoes that are black with a two-inch heel in a size 7.


Comments
0 comments
Please sign in to leave a comment.